Adam Nickel, Winnebago Gamefish Biologist, March 2016
As winter passes in the rear view mirror, it won’t be long until the spring rush of the 2016 walleye run is here. As anglers hit the water hoping to hook into some good walleye action, the Oshkosh DNR fisheries team will head to the Wolf and upper Fox Rivers to conduct the annual spring walleye spawning stock assessment. The Winnebago System boasts one of the top walleye fisheries in the Midwest and the spawning stock assessment provides key biological information about the population that helps guide management decisions. The primary objectives of the survey include: 1) marking fish with anchor (floy) tags to estimate angler exploitation and abundance, 2) evaluating age and size class distribution of the adult spawning stock, 3) monitoring adult growth and mortality rates, and 4) assessing spawning marsh conditions.
Note: Apologizes that the report will not format correctly with WordPress, and the graphs will not transfer. You may attempt to use the attached pdf which will require a second click to access at the bottom of the first loaded page. Access here by clicking the link, 2015 Winnebago Walleye Report
The 2015 sampling season came with some challenges as low spring water levels on the Wolf River left many of the traditional spawning marshes inaccessible by boat due to low flow conditions. As a result, walleyes appeared to mainly be staging in deeper water throughout the main channel during March and early April. A rain event that occurred during early April increased water levels to nearly 4,000 cubic feet per second (cfs) which provided some water influx to old channels and marshes that were well connected to the main channel (Figure 1). The small influx of water provided a window of opportunity for walleyes to move into the lower ends of marshes for spawning and allowed DNR staff to conduct electrofishing surveys.
However, adequate water depths in flooded locations were only found at the lower ends of the marshes, leaving the upper ends with less than suitable conditions for walleye spawning. In addition, the window of opportunity for walleye spawning and sampling was short as water levels dropped quickly by the end of April, leaving many of the walleye spawning marshes with little water or flow. Due to the poor spawning marsh conditions throughout the spring, many assumed that 2015 would produce a weak walleye year class.
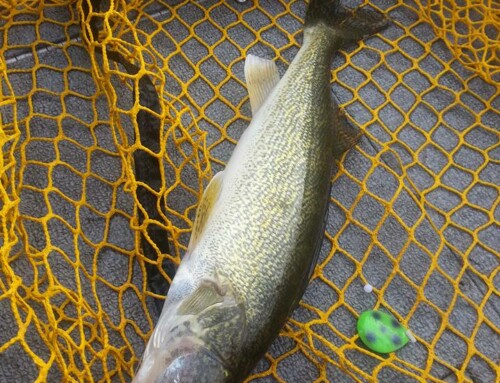
Assessment Trawl – YOY Walleye
The 2015 Lake Winnebago trawling assessment later revealed that a measureable, but weak walleye year class (1.4/trawl) was produced (Figure 2). Similarly, weak walleye year classes were noted in 2010 (0.9/trawl) and 2012 (0.2/trawl) which were also low water years with peak discharges of less than 5,000 cfs. Conversely, spring discharge on the Wolf River nearly surpassed 6,000 cfs during the high water years of 2011, 2013, and 2014 and strong walleye year classes were produced in 2011 (10.4/trawl) and 2013 (11.9/trawl). Therefore, it is clear that having high water and sufficient flow in the marshes is crucial for providing adequate walleye spawning habitat and suitable conditions for a large walleye hatch.
However, 2014 demonstrated that other factors can also drive year class strength despite having high water. For instance, after the first few days of hatching walleye fry absorb their yolk sac and then need a good available source of zooplankton for food to survive. The spring of 2014 was cooler than normal, resulting in below average water temperatures. Poor zooplankton hatches often coincide with cool water temperatures, thus it plausible that a lack of zooplankton during the 2014 spring walleye hatch contributed to the weak year class. Nonetheless, there are many factors that may drive the success or failure of the walleye hatch on any given year.
Despite some challenging conditions due to low water in 2015, DNR staff was able to tag 2,725 male and 500 female walleye on the Wolf River. Boat electrofishing surveys were conducted for 9 days (March 24-April 10) and targeted 7 different locations with the majority of the fish being tagged from April 6-10.
Therefore, it appeared that peak spawning occurred from early-mid April, which was the same time period that small rain events increased river discharge. However, low water levels and changing weather patterns throughout the spring resulted in a more protracted spawning period making it difficult to pinpoint when peak walleye spawning occurred. In comparison, peak walleye spawning in 2013 and 2014 occurred during mid-April, whereas surveys in 2012 indicated peak spawning during March 18-20.
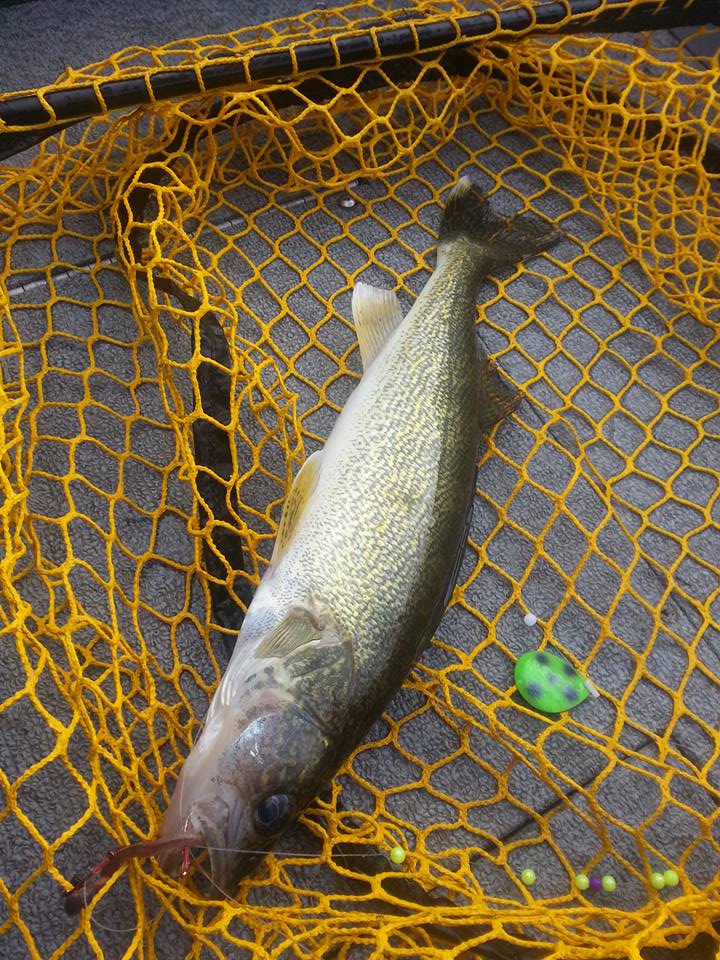
Male walleye ranged from 12.5-23.7 inches with an average length of 17.2 inches (Figure 3). The male age distribution was mainly comprised of the strong 2008 and 2011 year classes, 41.1% and 31.4% respectively (Figure 4).
Aside from the 2008 and 2011 year classes, males from 13 other year classes were sampled, but none represented greater than 5.7% of the sample. The oldest male walleye sampled were two 19 year olds, measuring 20.8 and 20.9 inches. Anglers are likely to find an addition of males from the strong 2013 year class roaming the spawning marshes this spring. Nearly 100% of male walleyes are mature by age 3 and the majority of the 2013 year class will make their first spawning run in 2016.
However, it should be noted that 2015 trawling surveys indicated that the 2013 year class has exhibited slower growth, averaging 12.0 inches during October sampling. In comparison, a 3 year old Winnebago System walleye in normal growing condition would be 14.9 inches for males and 16.9 inches for females. Nonetheless, it will be interesting to evaluate the growth and condition of these fish during spring surveys.
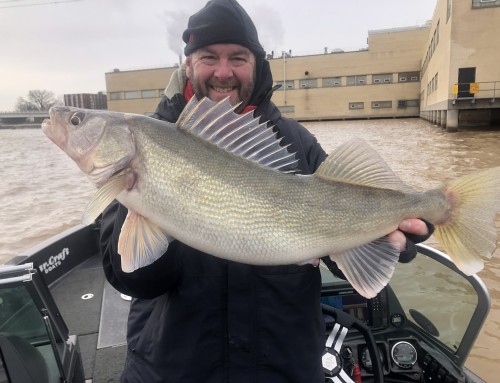
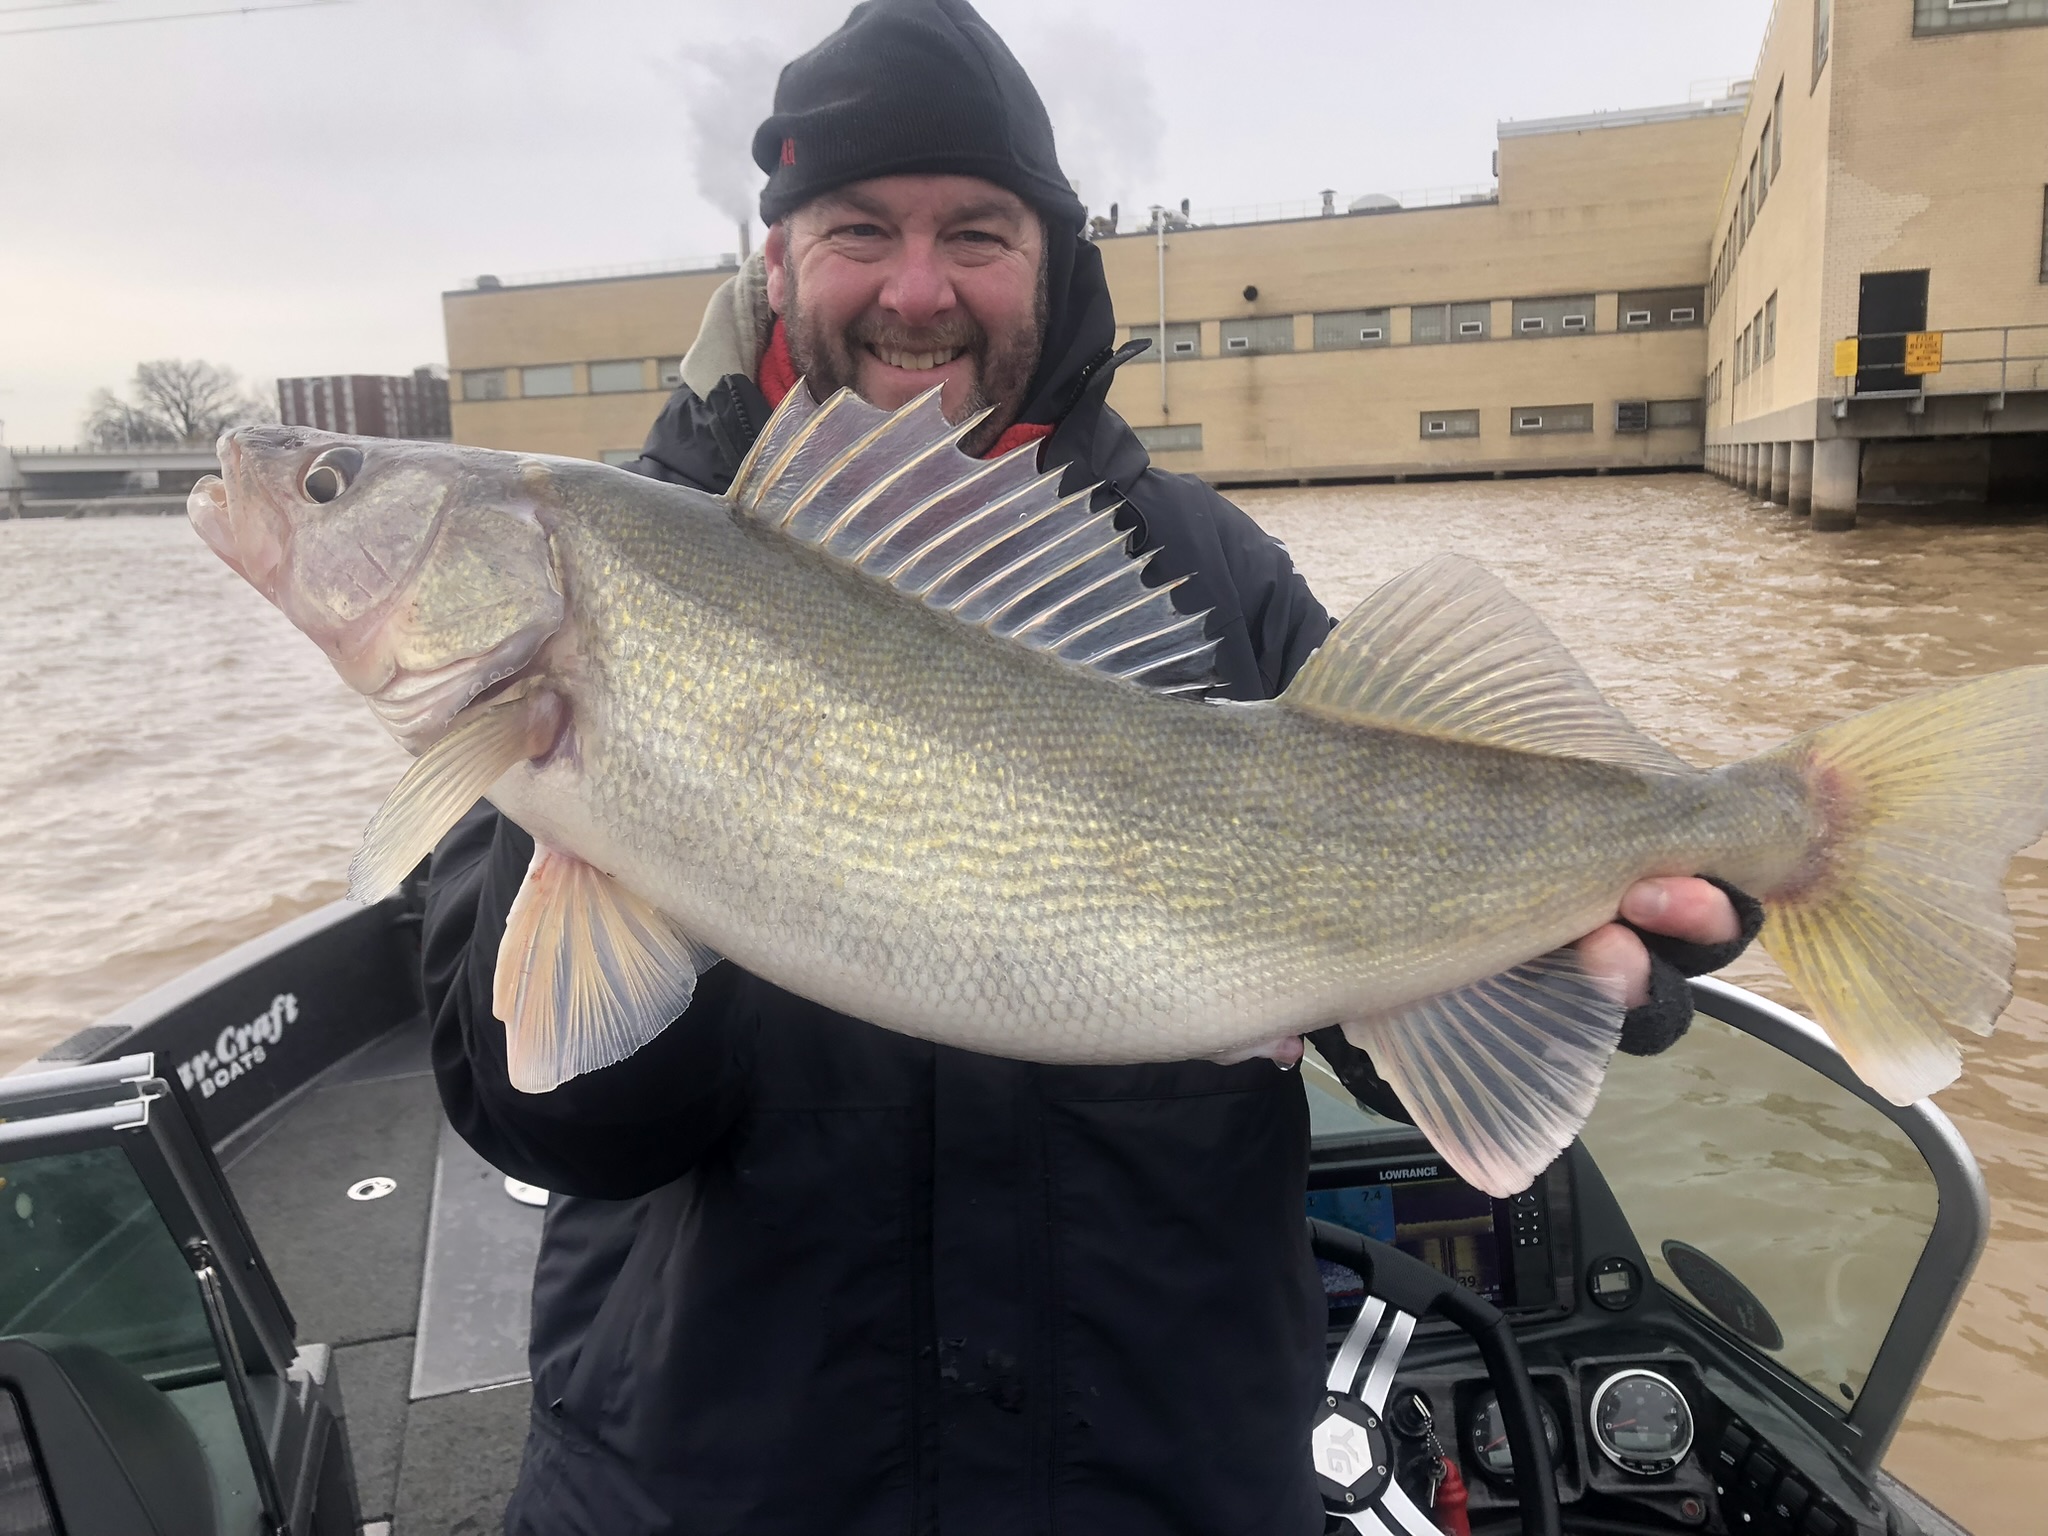
Female walleye sampled during the 2015 survey ranged from 15.6-27.2 inches with an average length of 22.1 inches (Figure 3). Similar to the males, the 2008 year class was well represented in the female age composition (45.6%; Figure 4). Further, the 2005 year class was still noticeable, comprising 16.6% of the females sampled. The next most prominent year class was 2011 (9.6%), but the majority of the females from this year class were believed to have still been immature as most females don’t mature until age 5.
This year class should become even more abundant in the spring of 2016 and anglers are likely to come across more fish ranging around 18-22 inches navigating up the Wolf and upper Fox Rivers in search of spawning habitat.
Aside from attaining size structure and age composition information, tagging walleye each spring to track annual exploitation rates is one of the primary objectives of the walleye spawning stock assessment. It was forecasted in the 2014 walleye report that 2015 could set up for a productive year of fishing and exploitation estimates have confirmed that prediction. Annual exploitation estimates were 21.8% for adult males and 28.6% for adult females in 2015, up from the overall average exploitation rates (1993-2015) of 14.7% for males and 20.8% for females (Figure 5).
The increase in exploitation rates was a notable change of pace compared to recent years (2010-2014) where exploitation levels stayed below 18%. The lower exploitation rates from 2010-2014 can likely be tied to forage base trends, specifically the strong hatches of gizzard shad in 2010 and 2012 that saturated the system with forage. As a result, walleye key in on these hatches, which makes fishing more difficult and lowers exploitation rates.
Sping 2015 Adult Walleye Size Structure
In addition to tagging mature walleye on the Wolf River, DNR staff also tagged 217 immature female walleye ranging from 14.0-20.5 inches and averaging 16.8 inches. These fish were primarily captured from Lake Winnebago on April 11th and April 14th. This was the first year that immature female walleye were tagged on the Winnebago System, so it was unknown what to expect for exploitation rates. The 2015 tag returns for the immature female walleye revealed an estimated exploitation rate of 41.6%. The results further confirmed that overall 2015 was a higher walleye exploitation year (particularly for females) which was likely driven by the low forage base conditions.
In fact, the lower overall forage base numbers in 2013 and 2014 were among the lowest forage levels observed since the early 1990s. Although adult female walleye exploitation rates generally stay below the 30% mark, the system has experienced several years where the recommended 30% threshold is surpassed, including 1997, 1998, and 2009. However, high exploitation rates were not sustained over consecutive years; for example, adult female exploitation rates reached 32.1% in 2009 and then decreased to 12.0% in 2010. The decrease was tied to the large gizzard shad hatch that occurred in 2010 that saturated the system with forage.
The high exploitation rate (41.6%) observed for immature females in 2015 was higher than any annual exploitation rate documented for adult males or adult females since tagging began in 1993. Therefore, DNR staff plan to tag more immature female walleye in 2016 to further evaluate exploitation rates and continue estimating immature female walleye exploitation on an annual basis. With the 2016 walleye run quickly closing in anglers are very interested in how this season may shape up and we often look to our bottom trawling survey results to estimate forage base levels and provide some guidance.
Figure 5. Exploitation of Walleye on the Winnebago System (1993-2015) with 50% Tag Reporting Rates
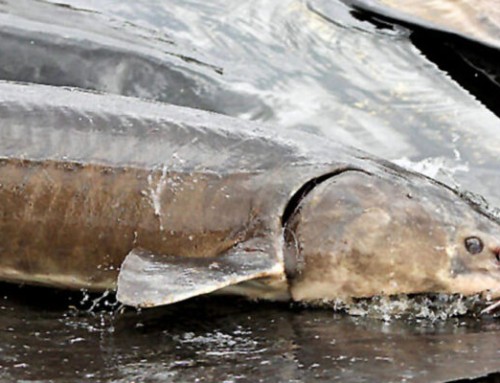
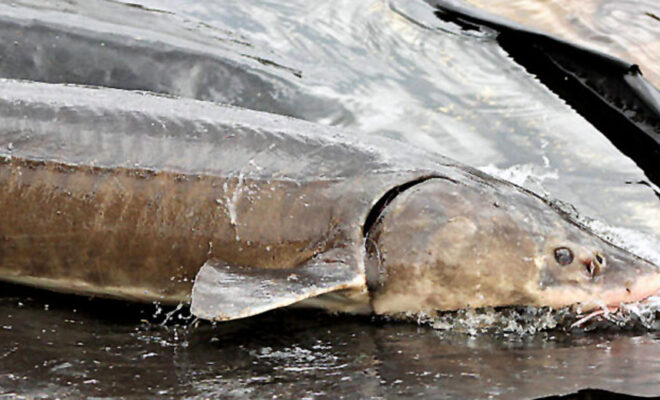
The 2015 Lake Winnebago bottom trawling survey indicated weak hatches for primary forage base species including trout perch (106.2/trawl), gizzard shad (11.7/trawl), and freshwater drum (15.7/trawl; Figure 6). Other forage base items such as yellow perch also demonstrated a weak hatch with below average catch rates (0.7/trawl). Based on the 2015 Lake Winnebago trawling results, many would estimate that 2016 could be another year of higher walleye exploitation rates. Although the 2015 trawling numbers indicated low gizzard shad abundance, it should be noted that local anglers did report seeing decent shad numbers along shoreline locations of Lake Winnebago and in the Upriver Lakes. The reports of greater shad numbers, particularly in the Upriver Lakes was verified when sturgeon diet analyses were conducted during the 2016 sturgeon spearing season. Only 20.6% of the sturgeon stomachs sampled from Lake Winnebago contained gizzard shad, compared to 90.6% of the stomachs sampled from the Upriver Lakes. Therefore, it remains to be seen if walleye also keyed in on gizzard shad and what impact the forage base has had on fish condition going into this season. We will have to wait for the 2016 angler tag return numbers to see how the season shapes up and where walleye exploitation rates land.
Thank you for taking the time to read the 2015 walleye report and learn more about Winnebago System fisheries management. Remember if you happen to catch a tagged walleye or yellow perch please mail them to the Oshkosh DNR office (625 East County Road Y, Oshkosh WI 54901), email them to [email protected], or call 920-303-5429. Good luck fishing in 2016 and be safe on the water!
Sincerely, Adam Nickel
Winnebago System Gamefish Biologist
Phone: (920) 424-3059 [email protected]
